- AQH Weekly Deep Dive
- Posts
- Exotic Credit Trading & Implied Correlation Surfaces
Exotic Credit Trading & Implied Correlation Surfaces
AlgoQuantHub Weekly Deep Dive
Nicholas Burgess
February 13, 2026

Welcome to the Deep Dive!
Here each week on ‘The Deep Dive’ we take a close look at cutting-edge topics on algo trading and quant research.
Last Week, we discussed correlation trading in credit markets and reviewed a dispersion trading strategy that looked to harvest credit correlation using first-to-default (FTD) credit default swaps.
This Week, we dive into how tranche prices reveal the market’s view of default clustering and show how to apply those insights into actionable FTD CDS pricing. By exploring CDX and iTraxx equity tranches, we uncover the implied correlations that drive first-to-default spreads, explain how to construct base correlation surfaces, and highlight the correlation skew that shapes risk across the capital structure. For quants and structured credit traders, this article turns the abstract mechanics of structured credit into a practical roadmap for understanding and pricing exotic credit instruments.
Bonus Content, here we take the concepts from the feature article and put them into practice. We outline how to build a base correlation surface from CDX tranche data and then use it to price a first-to-default CDS. This walkthrough shows how the market’s implied correlation translates into the basket hazard rate and drives the FTD spread, turning abstract theory into a concrete, actionable pricing framework.
Table of Contents
Feature Article: First-to-Default CDS Pricing - Why Does Implied Correlation Drives the Price?
A first-to-default CDS is a credit derivative that pays out upon the first default in a basket of companies. When pricing an FTD CDS, most of the risk lives in a single number: the market-implied correlation between the names in the basket. Consider three investment-grade tech names: AAPL, MSFT, and NVDA. Each has a very small probability of default individually, but the FTD CDS spread depends almost entirely on how likely those defaults are to cluster.
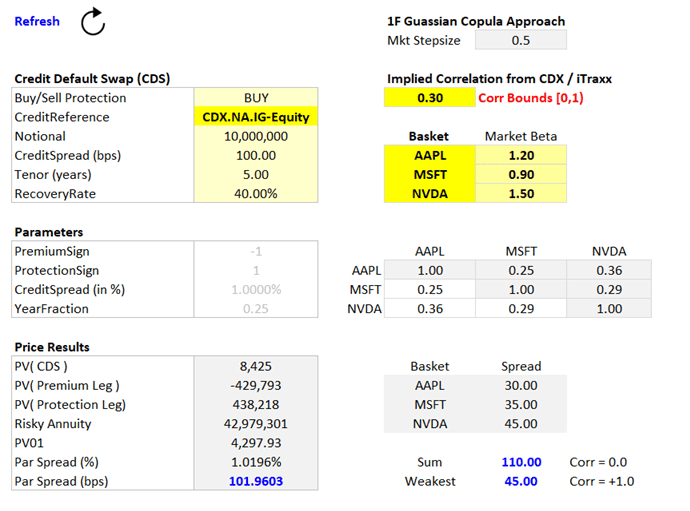
First-to-Default CDS
A correlation of 0 implies defaults are independent, so the FTD spread will roughly equal the highest single-name CDS spread in the basket—the “weakest link.”
A correlation of 1 implies the names default together every time, so the FTD spread approaches the sum of all single-name CDS spreads, as if the basket were a single risky entity.
To get a market-consistent correlation number, traders look to CDX or iTraxx tranches. A tranche is a slice of the portfolio loss distribution, and a detachment point marks the cumulative portfolio loss at which the tranche stops absorbing losses. For example, the 0–3% detachment equity tranche absorbs the first 3% of portfolio losses. The CDX.NA.IG equity tranche is the 0–3% slice of the 125-name North American investment-grade index. By calibrating a Gaussian copula, as outlined in last week’s bonus article and in Li (2000), to the equity tranche spread, we solve for the base correlation that reproduces observed tranche prices. This number encodes the market’s collective view on how defaults cluster and is critical for FTD pricing.
Stacking base correlations across detachment points and maturities produces a correlation surface, which is not flat: equity tranches typically imply lower correlation, while senior tranches imply higher correlation. This variation, called the correlation skew, reflects the market’s view that small losses may come from scattered defaults, but large losses only occur if multiple defaults happen together. Understanding the surface and skew lets you translate tranche data into actionable pricing for bespoke FTD or multi-name credit products.
Keywords: first-to-default CDS, CDX, iTraxx, base correlation, basket CDS, Gaussian copula, correlation trading, structured credit, tranche pricing, implied correlation, correlation surface, correlation skew
Recommended Reading:
 |  |
Premium Content: Credit Modelling
Learn how to calibrate single-name credit curves and construct the underlying interest-rate yield curves required for CDS pricing. The premium content presented provides a practical, hands-on framework for understanding how discount curves, hazard rates, and market spreads interact, and how single-name CDS valuations respond to changes in rates and credit assumptions. Together they offer a solid foundation for analysing credit instruments, building intuition around spread dynamics, and preparing the groundwork for more advanced correlation and portfolio credit modelling.
Link: Credit Modelling


Bonus Article: Building Base Correlation Surfaces to Price Your FTD CDS
Here we give an overview on how to build base correlation surfaces. Start with the equity tranche 125-name North American investment-grade index i.e. CDX.NA.IG equity tranche, the 5 year maturity and the 0–3% detachment point. This tranche absorbs the first 3% of portfolio losses. Using its market spread along with the index curve for the underlying names, we calibrate a Gaussian copula, as outlined in last week’s bonus article and in Li (2000), to match observed tranche PVs. For each detachment point—0–3%, 0–7%, 0–10%—we solve for the base correlation that reproduces the tranche price. Repeating this across maturities creates a baseline correlation surface, a lookup table mapping correlation as a function of detachment and maturity. This surface captures the market’s implied view of joint default behaviour for different slices of the portfolio loss distribution.
With the surface in hand, pricing a first-to-default CDS becomes straightforward. Conceptually, the FTD CDS can be treated like a single-name CDS, but with a basket hazard rate that incorporates the joint survival probabilities of all names, derived from the correlation surface. This hazard rate reflects both individual default risk and the chance that the first default occurs in a correlated system. Using this adjusted hazard rate in a standard CDS pricing framework gives a market-consistent FTD price.


CDS
By referencing the correlation surface, you can see precisely how systemic dependence drives the FTD spread, turning what looks like an exotic instrument into a practical, replicable pricing exercise.
Recommended Reading:
“Structured Credit Products: Pricing, Rating, Risk Management” – Moorad Choudhry
“Credit Risk Modelling: Theory and Applications” – David Lando
“An Introduction to Credit Derivatives” – Joerg Kienitz & Daniel Wetterau
Keywords:
base correlation, correlation surface, FTD CDS, first-to-default CDS, Gaussian copula, CDX.NA.IG, iTraxx, tranche pricing, credit derivatives, hazard rates, joint default probability
Algo Quant YouTube Channel
Algo Trading & Quant Research Channel
YouTube playlists include:
Interest Rate Markets
Bond Markets
Credit Derivatives
Monte Carlo Simulation
Advanced Quant Models
American Option Trading
Live Algo Trading with IB Broker

Exclusive Algo Quant Store Discounts
Algo Trading & Quant Research Hub
Get 25% off all purchases at the Algo Quant Store with code 3NBN75MFEA.

Useful Links
Quant Research
SSRN Research Papers - https://ssrn.com/author=1728976
GitHub Quant Research - https://github.com/nburgessx/QuantResearch
Learn about Financial Markets
Subscribe to my Quant YouTube Channel - https://youtube.com/@AlgoQuantHub
Quant Training & Software - https://payhip.com/AlgoQuantHub
Follow me on Linked-In - https://www.linkedin.com/in/nburgessx/
Explore my Quant Website - https://nicholasburgess.co.uk/
My Quant Book, Low Latency IR Markets - https://github.com/nburgessx/SwapsBook
AlgoQuantHub Newsletters
The Edge
The ‘AQH Weekly Edge’ newsletter for cutting edge algo trading and quant research.
https://bit.ly/AlgoQuantHubEdge
The Deep Dive
Dive deeper into the world of algo trading and quant research with a focus on getting things done for real, includes video content, digital downloads, courses and more.
https://bit.ly/AlgoQuantHubDeepDive
 |  |
Feedback & Requests
I’d love your feedback to help shape future content to best serve your needs. You can reach me at [email protected]