- AQH Weekly Deep Dive
- Posts
- Lasso Regression for Algo Traders - Denoise Your Models and Predict Markets Better
Lasso Regression for Algo Traders - Denoise Your Models and Predict Markets Better
AlgoQuantHub Weekly Deep Dive
Nicholas Burgess
December 19, 2025

Welcome to the Deep Dive!
Here each week on ‘The Deep Dive’ we take a close look at cutting-edge topics on algo trading and quant research.
Last week, we examined how to maximize savings and investment growth and minimize taxes with examples in the UK and USA. We discuss savings and investment portfolios, allocation weights, savings, money market ETFs, fixed income, equity ETFs, commodities, tax-free and tax deferral investments to boost growth and compounding.
This week, we look to build better predictive models for markets. With noisy financial data, overfitting is a constant challenge—your model might look great on historical data but fail when applied live. We’ll explore how Lasso regression, a powerful tool from the world of machine learning, can help denoise your data, simplify models, and improve predictive accuracy. Using a simple yet intuitive example, we’ll demonstrate how Lasso can automatically remove irrelevant or spurious predictors, leaving only the variables that truly matter.
Bonus Content, We include a hands-on Python Lasso Regression example showing how trying to fit noisy market data with a high-degree polynomial can lead to overfitting, and how Lasso regression elegantly reduces it to the right degree, making the model both more accurate, interpretable and robust.
Table of Contents
Exclusive Algo Quant Store Discounts
Algo Trading & Quant Research Hub
Get 25% off all purchases at the Algo Quant Store with code 3NBN75MFEA.

Feature Article: Lasso Regression - Shrinking Noise, Improving Predictions
In quantitative finance and algorithmic trading, one of the biggest challenges is how to distinguish the signal from noise. Markets are inherently noisy: random fluctuations, spurious correlations, and redundant indicators can all mislead a predictive model. Overfitting—where a model captures the random quirks of historical data rather than the underlying relationships—can lead to poor real-world performance, even if the model looks perfect on backtests.
Lasso regression offers a mathematically elegant solution. At its core, Lasso is a type of linear regression that adds a model penalty proportional to the sum of the absolute values of the coefficients. Formally, Lasso minimizes:

where y(i) are the observed values, y^(i) the predicted values, β(j) the model coefficients, p the number of features, and α is the regularization strength. The L1 penalty encourages sparsity: coefficients for irrelevant or redundant features are shrunk to zero, leaving a simpler, more interpretable model.
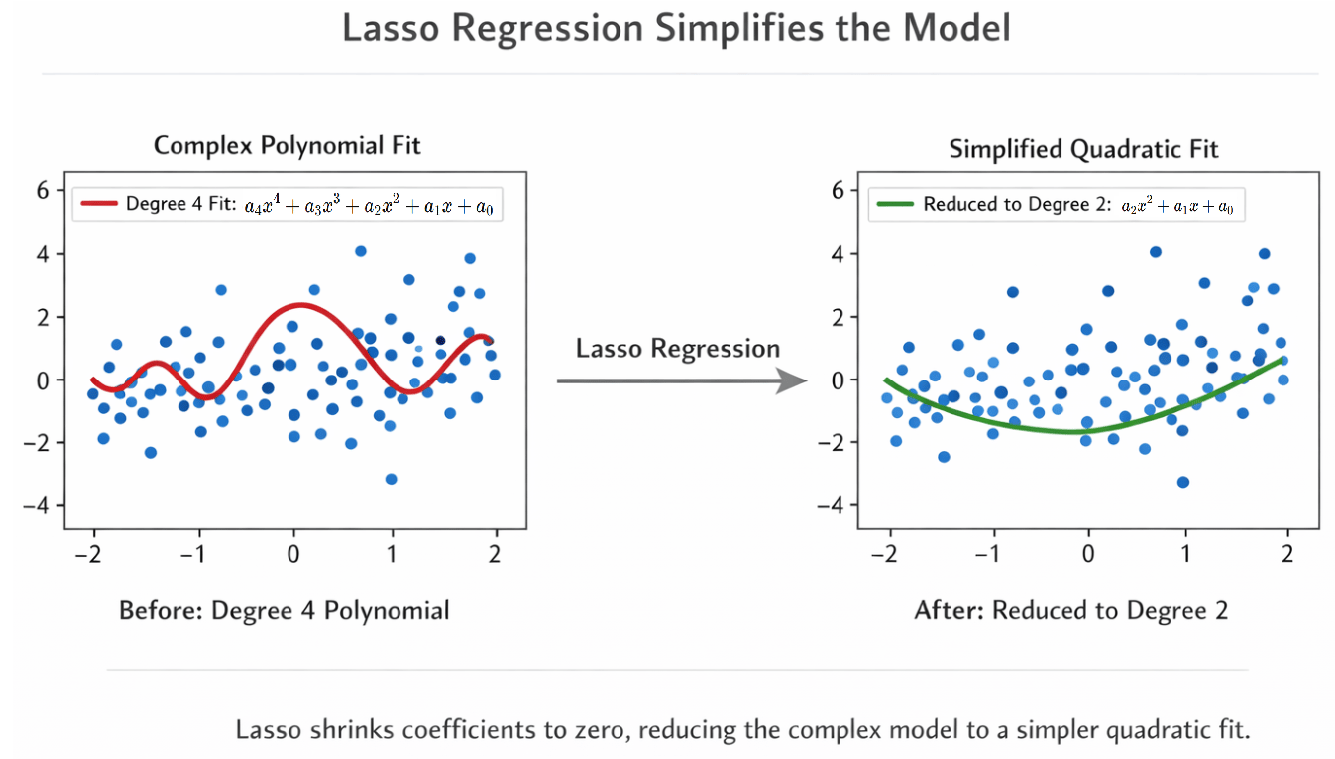
To see this in action, consider a simple example from market modelling. Suppose we have noisy observations that are best fit using a degree 2 polynomial (representing some underlying market relationship) and our regression-like model suggests a degree 4 polynomial. The result is overfitting: the curve wiggles excessively, trying to match random noise in the data. Lasso regression, by contrast, removes overfitting and automatically shrinks the coefficients for the higher-degree terms toward zero, leaving only the meaningful degree 2 components as shown below. The model is smoother, easier to interpret, and better suited to predicting unseen data.
When to Use Lasso in Finance:
When you have many predictors, some of which may be irrelevant or redundant.
When you want to simplify your model and make it interpretable.
When reducing noise can improve out-of-sample predictive performance.
Pros of Lasso:
Encourages sparse solutions, automatically selecting only the most relevant features.
Reduces overfitting by penalizing complex models.
Produces interpretable models, which is valuable for explaining trading decisions.
Cons / Caveats:
Lasso can zero out the wrong parameters when predictors are highly correlated. For example, if two indicators are strongly correlated, Lasso may arbitrarily keep one and shrink the other to zero.
The choice of α is critical; too large, and important features may be eliminated (underfitting), too small, and the model may overfit.
Lasso assumes a linear relationship between predictors and target; nonlinearities require preprocessing or feature engineering.
In financial applications, this principle is invaluable. Whether you are analysing macroeconomic indicators, technical signals, or multi-factor models, Lasso can help filter out spurious drivers of returns, allowing your algorithms to focus on the variables that truly move the market. By tuning the α parameter, often via cross-validation, traders can control the balance between model complexity and predictive accuracy—a critical trade-off in any quantitative strategy.
Ultimately, Lasso regression is a tool that combines statistical rigor with practical interpretability, giving quants and algo traders a way to tame noisy financial data and build models that are both robust and actionable.
Further Reading
Scikit‑learn Lasso model selection example (cross‑validation & AIC/BIC) — see how Lasso’s alpha can be selected using CV or information criteria in practice: scikit‑learn Lasso model selection
Feature selection with LassoCV and SelectFromModel — a practical Python walkthrough of using Lasso for automatic feature importance and selection: GeeksforGeeks: Feature selection using LassoCV
Difference between Lasso, Ridge, and Elastic Net — understand how Lasso’s L1 penalty compares to Ridge’s L2 and how Elastic Net blends both:
Lasso and Ridge Regression tutorial (DataCamp)Scikit‑learn examples on sparse models — showcases how Lasso and Elastic Net recover sparse signals and how they behave with correlated features:
L1‑based models for Sparse SignalsLasso regression from scratch in Python — a deeper technical tutorial if you want to implement and understand the mechanics of Lasso yourself:
Implementation of Lasso regression from scratch
Keywords:
Lasso regression, overfitting, regularization, algorithmic trading, quantitative finance, predictive modelling, denoising financial data, feature selection, sparse models, polynomial regression, cross-validation, Elastic Net, machine learning for trading, financial modelling techniques, robust trading models, quantitative research, market prediction, model interpretability, bias-variance trade-off, noise reduction
Bonus Article: Visualizing Lasso Regression – From Overfitting to Simplicity
In this bonus section, we provide a concrete demonstration of how Lasso regression can denoise data and simplify models, even when the original data is noisy.
For our example of Lasso regression, imagine a scenario where you have a true underlying quadratic relationship in your data, but with noise—just like financial returns influenced by multiple factors with randomness.
Coded in the example below we demonstrate in Python how Lasso regression can be used to denoise the data, minimize overfitting and effectively reduce the degree of the fitted polynomial to best fit the data. Below is the Python code.
We compared:
Degree 4 polynomial fit using ordinary linear regression → tends to overfit the noise.
Lasso regression fit → automatically shrinks irrelevant higher-degree terms, leaving only the important quadratic structure.
Key Takeaways for Algo Trading
Blue curve (degree 4 fit): Overfits the noise in your data, similar to a trading model chasing random fluctuations.
Red curve (Lasso fit): Smooth and interpretable; automatically ignores unnecessary high-degree terms, focusing on the real signal.
Optimal Alpha: Chosen via cross-validation to balance underfitting and overfitting.
In a trading context, this is equivalent to filtering out irrelevant market indicators or noisy technical signals, letting your models focus on what actually drives asset behaviour. It’s a simple example, but it clearly illustrates the power of Lasso regression to simplify and robustify predictive models.

import numpy as np
import matplotlib.pyplot as plt
from sklearn.linear_model import Lasso, LinearRegression
from sklearn.preprocessing import PolynomialFeatures

# -----------------------------
# Generate noisy quadratic demo data
# -----------------------------
np.random.seed(42) # Random seed for reproducibility
x = np.linspace(-3, 3, 30).reshape(-1, 1)  # fewer points
y = 2.0 * x**2 + 1.0 * x + 3.0 + np.random.randn(30, 1) * 8

# Flatten y
y = y.ravel()

# -----------------------------
# Degree 4 polynomial fit (overfitting)
# -----------------------------
poly4 = PolynomialFeatures(degree=4, include_bias=False)
X_poly4 = poly4.fit_transform(x)
linreg4 = LinearRegression()
linreg4.fit(X_poly4, y)
y_poly4 = linreg4.predict(X_poly4)

# -----------------------------
# Lasso regression (effectively degree 2)
# -----------------------------
lasso = Lasso(alpha=2.0, max_iter=10000)  # stronger regularization
lasso.fit(X_poly4, y)
y_lasso = lasso.predict(X_poly4)

# -----------------------------
# Plot comparison
# -----------------------------
plt.figure(figsize=(8,5))
plt.scatter(x.ravel(), y, color='gray', alpha=0.7, label='Noisy data')
plt.plot(x.ravel(), y_poly4, color='blue', linewidth=2, label='Degree 4 polynomial (overfit)')
plt.plot(x.ravel(), y_lasso, color='red', linewidth=2, label='Lasso fit (effectively degree 2)')
plt.xlabel("x")
plt.ylabel("y")
plt.title("Overfitting vs Lasso Regularization")
plt.legend()
plt.show()

# -----------------------------
# Print coefficients
# -----------------------------
coef_names = poly4.get_feature_names_out(['x'])
print("Degree 4 polynomial coefficients (LinearRegression):")
for name, coef in zip(coef_names, linreg4.coef_):
    print(f"{name}: {coef:.3f}")

print("\nLasso coefficients (alpha=2.0):")
for name, coef in zip(coef_names, lasso.coef_):
     print(f"{name}: {coef:.3f}")
Keywords:
Lasso regression, polynomial regression, overfitting, cross-validation, denoising financial data, feature selection, sparse models, regularization, predictive modelling, machine learning for trading, algorithmic trading, quantitative finance, robust trading models, noisy data, model simplification, alpha selection, trading signal filtering, Python example
Useful Links
Quant Research
SSRN Research Papers - https://ssrn.com/author=1728976
GitHub Quant Research - https://github.com/nburgessx/QuantResearch
Learn about Financial Markets
Subscribe to my Quant YouTube Channel - https://youtube.com/@AlgoQuantHub
Quant Training & Software - https://payhip.com/AlgoQuantHub
Follow me on Linked-In - https://www.linkedin.com/in/nburgessx/
Explore my Quant Website - https://nicholasburgess.co.uk/
My Quant Book, Low Latency IR Markets - https://github.com/nburgessx/SwapsBook
AlgoQuantHub Newsletters
The Edge
The ‘AQH Weekly Edge’ newsletter for cutting edge algo trading and quant research.
https://bit.ly/AlgoQuantHubEdge
The Deep Dive
Dive deeper into the world of algo trading and quant research with a focus on getting things done for real, includes video content, digital downloads, courses and more.
https://bit.ly/AlgoQuantHubDeepDive
 |  |
Feedback & Requests
I’d love your feedback to help shape future content to best serve your needs. You can reach me at [email protected]